Editor’s note: Are you on the bleeding edge of alternative investments? Do you eat, sleep and breathe cryptocurrency trends?
The Early Investing team is currently on the lookout for a senior managing editor. If you’re interested in being part of an exciting publication that’s always on the lookout for new investment opportunities, email your cover letter and resume to mailbag@earlyinvesting.com.
Dear Early Investor,
Last week, I told you about how adding a technical analysis layer to my stock vetting made me a much better investor.
This week, I’m going to share with you how I do it.
Of course, I can’t tell you everything in one short article. My partner Adam has already discussed a neat technical analysis tool called the relative strength index. Read his piece here if you haven’t already. It’s definitely worth a few minutes of your time.
Today, I’ll be discussing another neat tool: Fibonacci retracements.
It’s not the only tool I use. In fact, Fibonacci is most effective when used with other technical indicators. But it’s definitely one I like a lot.
For one, it’s versatile. It can help predict the extent of both pullbacks and rallies.
So what exactly are Fibonacci retracements?
They’re ratios that indicate when price reversals may be drawing near.
What this means is when a price line hits these levels, it signals a possible turnaround. When other technical indicators also point to a turnaround at the same time, the signal is amplified.
The most common Fibonacci ratios are 23.6%, 38.2% and 61.8%. (You’ll also see a 50% level with most Fibonacci charts – though technically, it’s not a part of the Fibonacci sequence.)
Curious as to where these ratios come from?
Well, we have to go back nearly a thousand years to identify their origins.
Leonardo Pisano Bigollo (aka Fibonacci) was a mathematician from Pisa who introduced the Fibonacci sequence to the West in the 12th century. It is as follows: 0, 1, 1, 2, 3, 5, 8, 13, 21, 34, 55, 89, 144, 233, 377, 610… and so on to infinity.
Fibonacci demonstrated how a number divided by the previous number in his sequence approximates 1.618. And, lo and behold, a number divided by the next highest number approximates 0.6180.
It’s known as the “golden ratio,” and it is the ratio I consider the most important. (By the way, the inverse of 1.618 is approximately 0.618!)
What I find fascinating is that these ratios are also found throughout nature, architecture, art and biology. They can be seen in everything from sunflowers to the spirals in galaxies.
The next most significant number? It’s 0.3820.
It’s the number you get when you take one of Fibonacci’s sequence numbers and divide it by another one two places higher. For example: 13/34 = .382. (Also note that 1 – .618 = .382.)
Years ago, I used these ratios for stock price analysis. Now I’m back at it, using them to help predict crypto price movements. It’s like meeting an old friend!
They’re called retracement levels (or ratios) because they refer to price movements that retrace in the opposite direction of a previous leg up or down.
As the bounce or correction approaches these retracement levels, technical analysts become increasingly aware of a possible price reversal, especially when other indicators are chiming in.
To illustrate just how Fibonacci works, I’m going to show you three bitcoin charts. For purposes of clarity, I’m not including other technical indicators, so keep in mind these charts have been simplified to an extent.
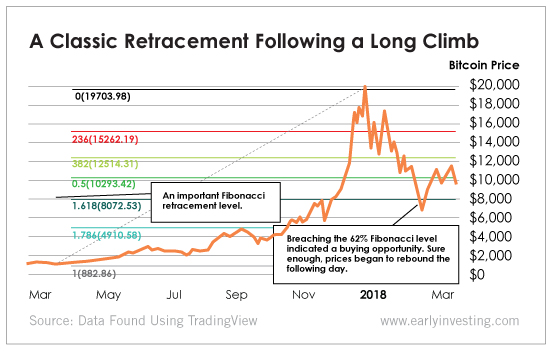
After a long climb, bitcoin finally peaked last December and began retracing some of the gains it previously made.
But by how much?
Remember, I said that 61.8% was the level I paid most attention to. You’ll notice in the chart that once prices broke below that important level, they immediately began a new leg up.
What can you do with this information?
When others may be thinking of selling, you’re thinking of buying on the dip. At the very least, it prevents you from selling at the wrong time.
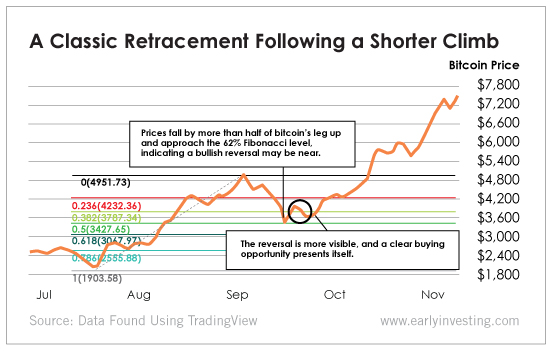
Here’s another bitcoin chart using the Fibonacci levels from earlier, identifying a smaller leg up from last September…
As prices approach the 61.8% level, the possibility of a price reversal once again presents itself.
And another buying opportunity is indicated in advance using the Fibonacci levels.
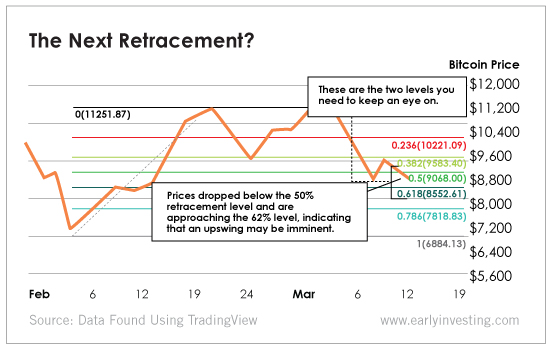
So what about right now?
What can the Fibonacci levels tell us about current price movements?
With prices just shy of the 61.8% level, they say that a rally could be imminent.
A couple of things to remember here…
While Fibonacci puts me on the alert for a price reversal, I like to see it actually happening before issuing a buy or sell alert. And, as I’ve said, I like to see other indicators supporting what Fibonacci is telling me.
As I mentioned last week, we’re dealing in probabilities here, not certainties. So even though I now have a technical system in place (I call it the “Cadillac of technical analysis systems”) telling me how much lower prices need to go for an upswing to occur, there are no guarantees.
Nonetheless, these kinds of technical analysis tools go a long way in helping me understand price trends and manage risk.
We are now better equipped to give our members insightful buy and sell guidance so they can optimize gains, minimize losses and, at the end of the day, show greater overall crypto profits.
Soon, in our Crypto Asset Strategies service, we’ll focus much more on using technical analysis like this to help us vet new crypto recommendations. If this kind of approach interests you, be sure to keep a close eye on our upcoming alerts.
Good investing,
Andy Gordon
Co-Founder, Early Investing


