I was sifting through Oregon’s marijuana sales data last week when I spotted something interesting – the perfect example of supply and demand affecting prices.
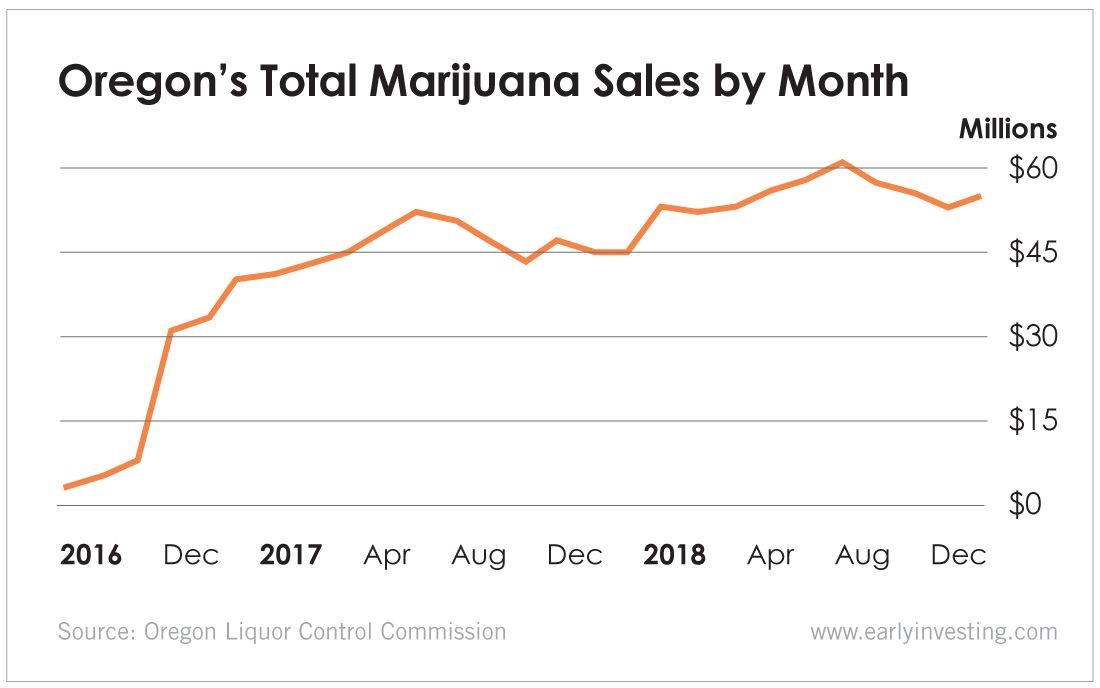
Our first chart shows that, on average, marijuana sales have steadily increased since the fall of 2016. But there have been blips on the radar.
In both 2017 and 2018, marijuana revenue dropped from August to November. I initially wrote it off as some sort of seasonal demand issue. Boy was I wrong.
After digging a little deeper, I discovered sales didn’t drop because of a seasonal demand issue. They dropped because of a seasonal supply issue.
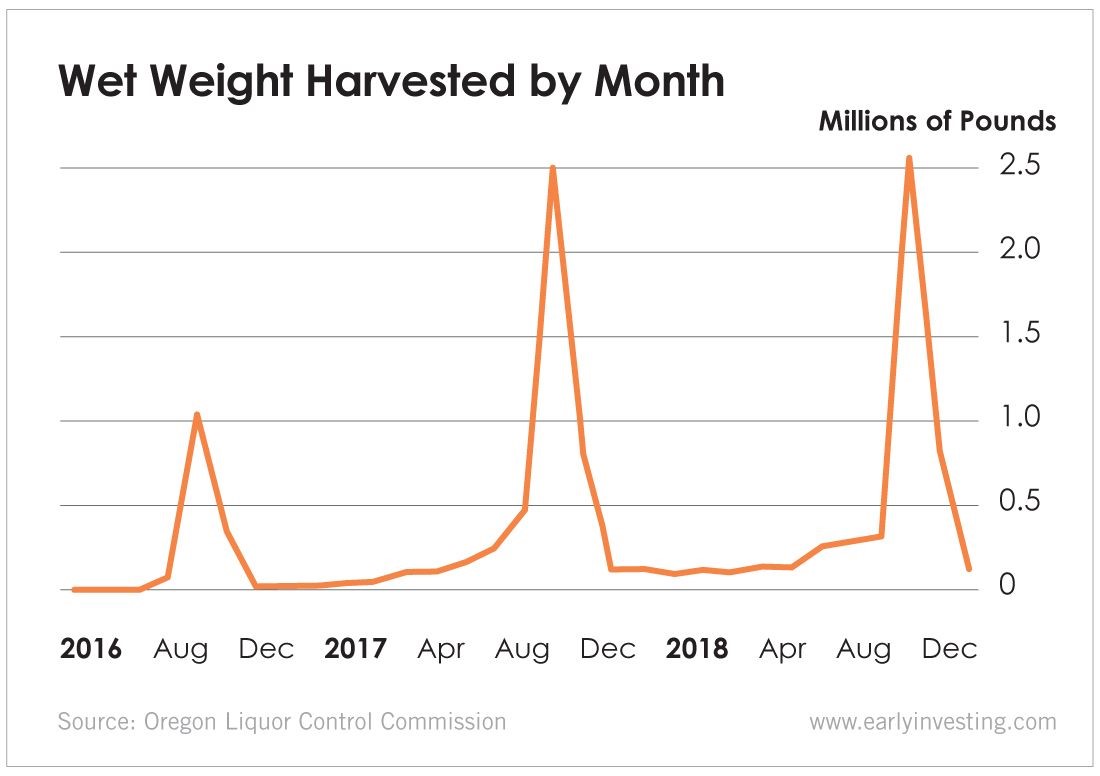
As the second chart shows, August through November is harvesting season for marijuana in Oregon. And October is peak harvesting season. These months are when the new marijuana supply hits the market, which drives prices down.
And it’s those lower prices that create the revenue dips we saw in the first chart.
It’s a classic case of supply and demand. Demand stays constant or grows incrementally. Supply rises significantly. Prices go down.
I love it when the market works the way it’s supposed to.